Exercise 5: Making Useful Figures
Overview
Teaching: 10 min
Exercises: 10 minQuestions
How does one make useful benchmark figures?
Objectives
Learn what information is useful to ePIC in developing benchmark artifacts and figures
We’ve discussed how to plug your analysis script into GitLab’s CI, and monitor it using pipelines. We’ll now briefly discuss how to make figures for your benchmark that are useful to both yourself and to others.
Making benchmark figures
The plots created in a benchmark should be designed to be legible not only to yourself, but to those working on detector and software development. This means benchmark plots should be clearly labeled with
- beam settings if any (ep, eAu, … and (5 \times 41), (10 \times 100) GeV, …)
- event generator used
- kinematic cuts ($x$, $Q^2$, $W$)
- EPIC label
- legible axis labels
Ideally, benchmark designers should aim to design paper-ready figures labeled with large clear text and a perceptual color palette. Remember that we want to create figures that can be used as-is in the TDR, in conference presentations, and in evaluating detector and software performance.
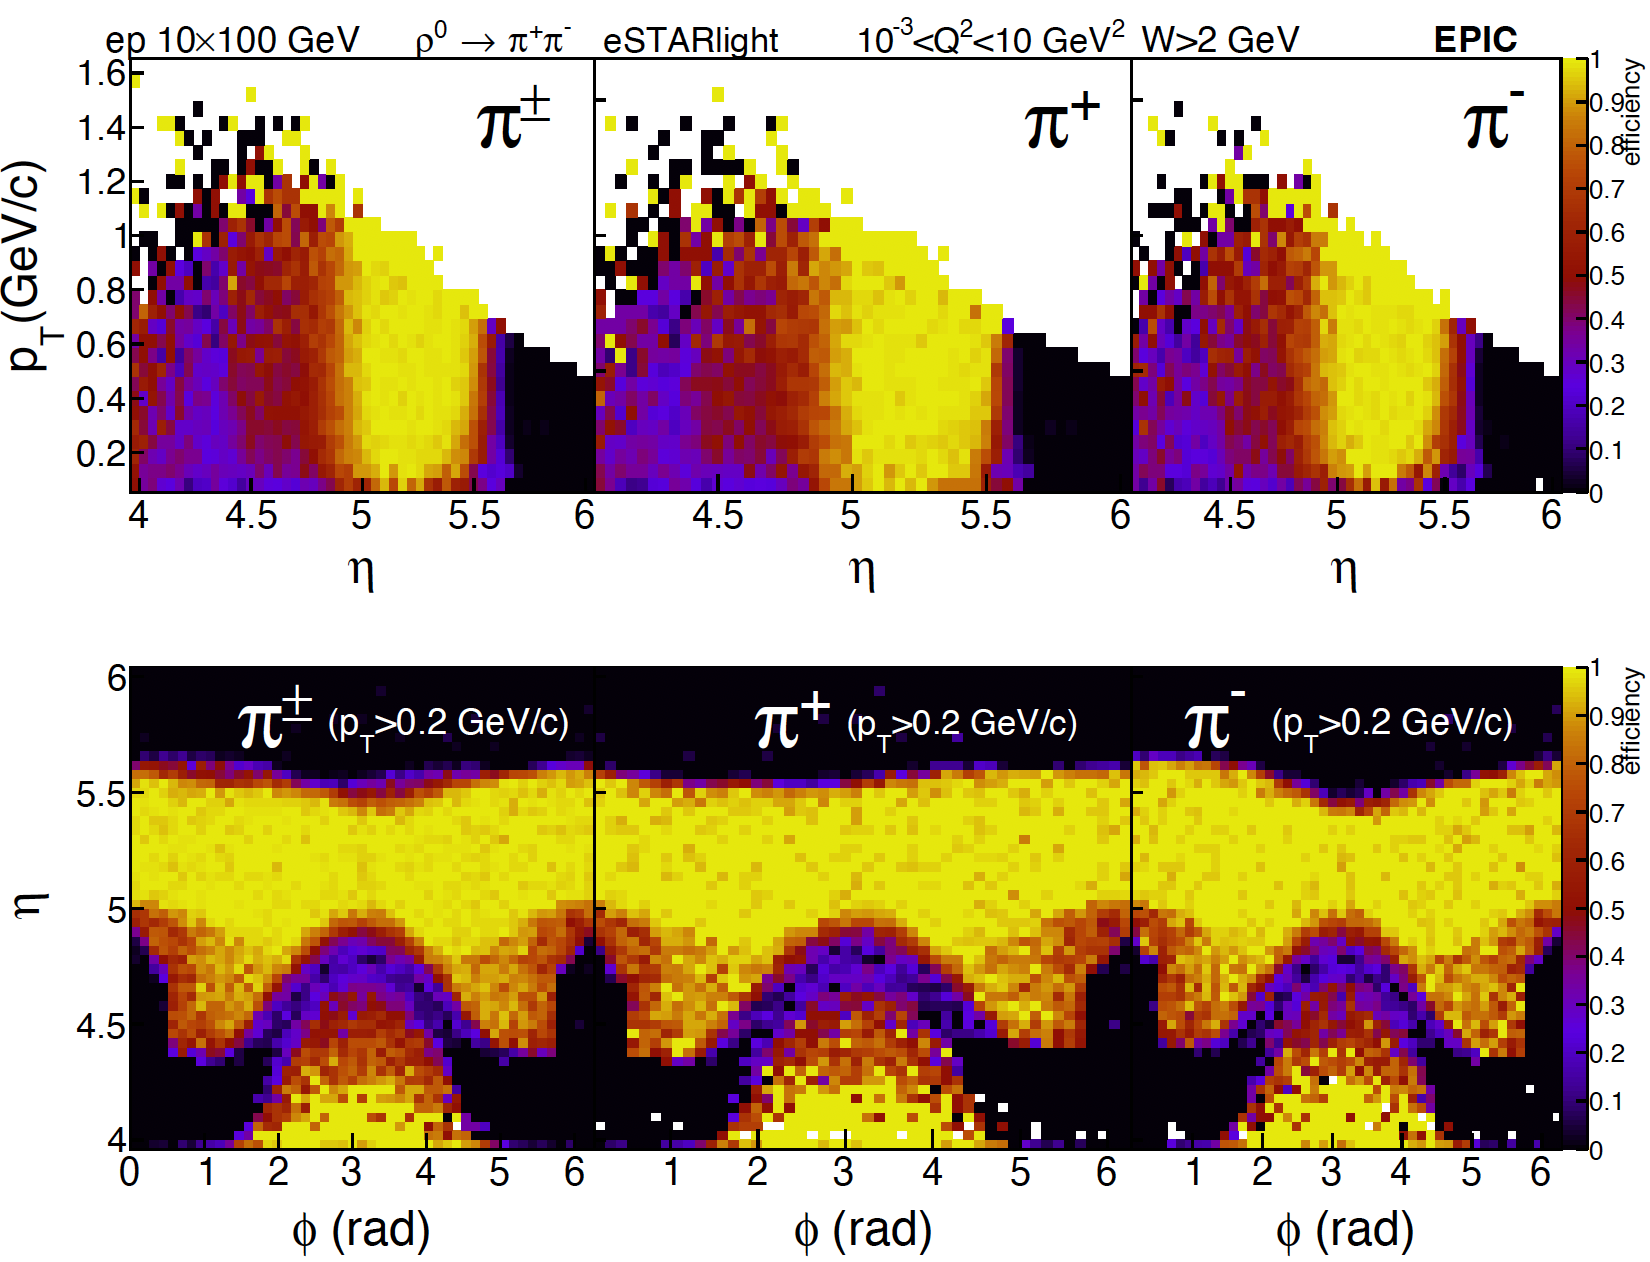
An example figure from the u-channel rho benchmark is shown here:

In this example, the plot is labeled with the collision system and other details:
TLatex* beamLabel       = new TLatex(0.18, 0.91, "ep 10#times100 GeV");
TLatex* epicLabel       = new TLatex(0.9,0.91, "#bf{EPIC}");
TLatex* kinematicsLabel = new TLatex(0.53, 0.78, "10^{-3}<Q^{2}<10 GeV^{2}, W>2 GeV");
TLatex* generatorLabel  = new TLatex(0.5, 0.83, ""+vm_label+" #rightarrow "+daug_label+" eSTARlight");
The axis labels and titles were scaled for clarity:
histogram->GetYaxis()->SetTitleSize(histogram->GetYaxis()->GetTitleSize()*1.5);
histogram->GetYaxis()->SetLabelSize(histogram->GetYaxis()->GetLabelSize()*1.5);
The number of axis divisions was decreased to reduce visual clutter:
histogram->GetXaxis()->SetNdivisions(5);
And margins were increased to allow for more space for larger axis labels:
virtualPad->SetBottomMargin(0.2);
Describing your benchmark figures
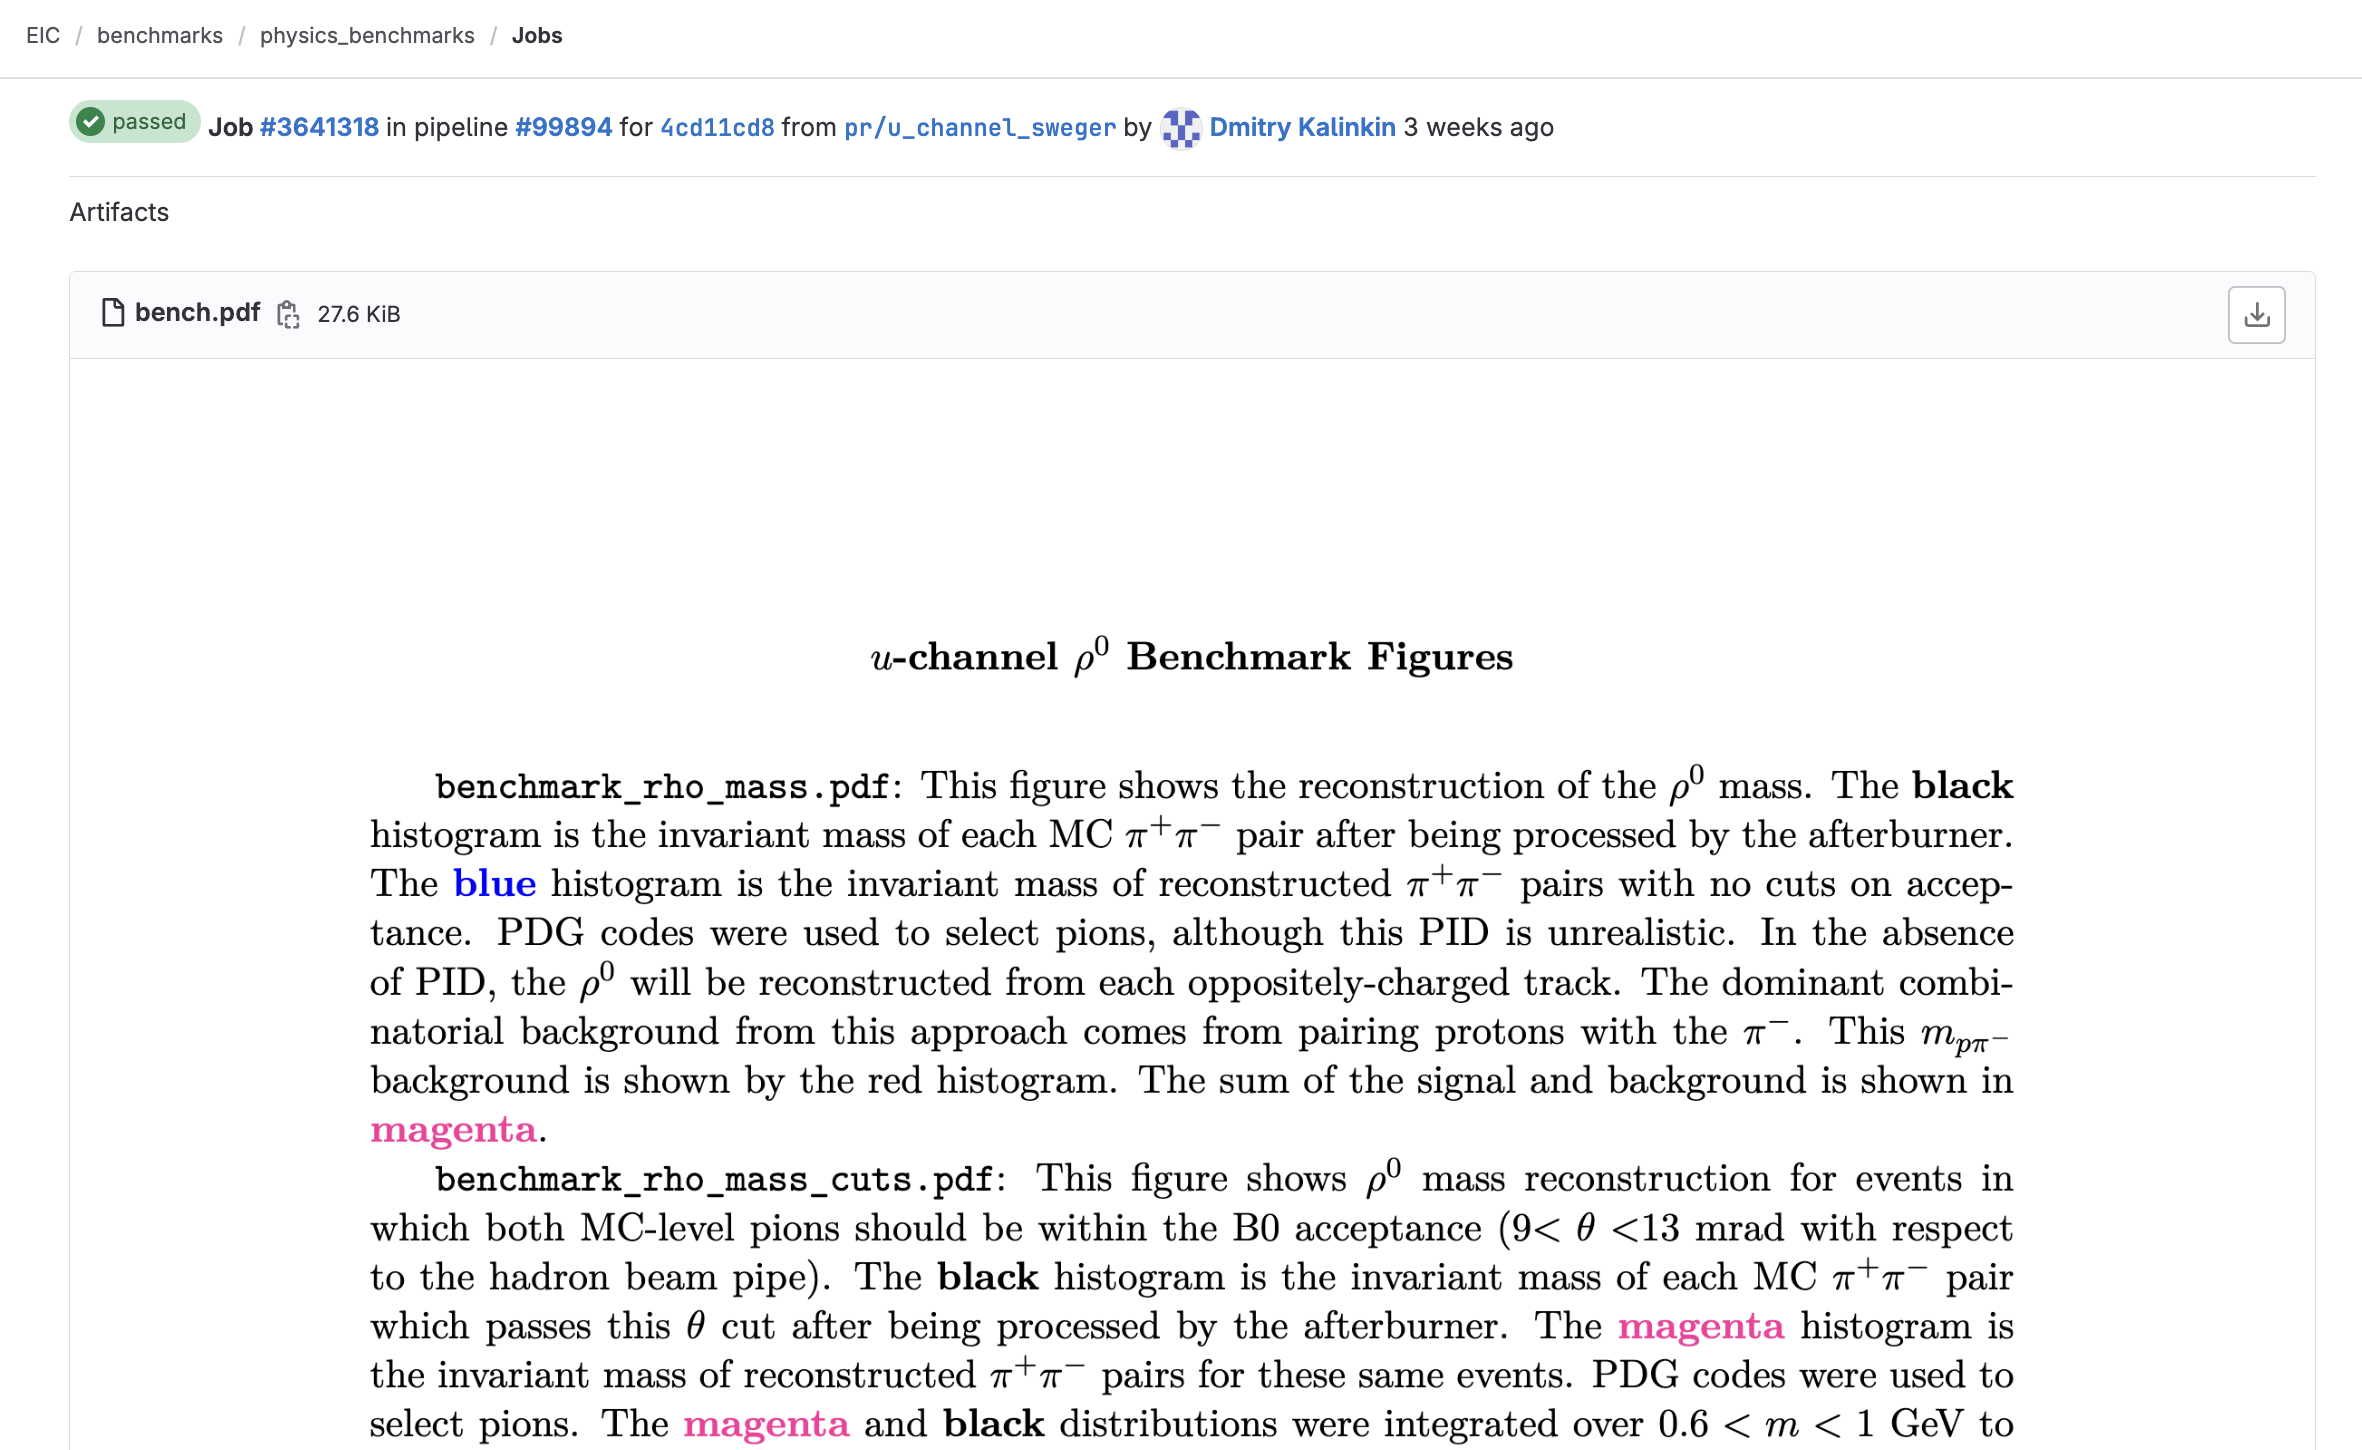
Even a well-labeled figure will still be ambiguous as to what is being plotted. For example, how you define efficiency may differ from another analyzer. It will be useful to include with your benchmark an explainer of each of the various plots that are produced:

This document may be written in LaTeX, exported as a PDF, and then uploaded to GitHub under your benchmark.
The way most users will interact with your benchmark is at the level of the artifacts it produces. When others are looking through the plots produced by your benchmark, this description of your figures should be readily available as an artifact itself. To achieve this, you can use this template tex document:
%====================================================================%
%                  BENCH.TEX                                       %
%           Written by YOUR NAME                                   %
%====================================================================%
\documentclass{bench}

% A useful Journal macro
\def\Journal#1#2#3#4{{#1} {\bf #2}, #3 (#4)}
\NewDocumentCommand{\codeword}{v}{\texttt{\textcolor{black}{#1}}}
% Some other macros used in the sample text
\def\st{\scriptstyle}
\def\sst{\scriptscriptstyle}
\def\epp{\epsilon^{\prime}}
\def\vep{\varepsilon}
\def\vp{{\bf p}}
\def\be{\begin{equation}}
\def\ee{\end{equation}}
\def\bea{\begin{eqnarray}}
\def\eea{\end{eqnarray}}
\def\CPbar{\hbox{{\rm CP}\hskip-1.80em{/}}}

\begin{document}
\title{YOUR BENCHMARK NAME Benchmark Figures}
\maketitle

\codeword{benchmark_plot1.pdf}:
This figure shows...

\end{document}
Create this bench.tex file at the top of your benchmark (physics_benchmarks/benchmarks/your_bench/). Also copy bench.cls to the same location to define the bench document class.
Finally, add a rule to the Snakefile to compile the tex file, and create output in the results directory. This ensures the resulting pdf will be included as an artifact.
rule yourbench_compile_manual:
    input:
        cls=workflow.source_path("bench.cls"),
        tex=workflow.source_path("bench.tex"),
    output:
        temp("tectonic"),
        cls_tmp=temp("bench.cls"),
        pdf="results/bench.pdf",
    shell: """
wget https://github.com/tectonic-typesetting/tectonic/releases/download/tectonic%400.15.0/tectonic-0.15.0-x86_64-unknown-linux-musl.tar.gz
tar zxf tectonic-0.15.0-x86_64-unknown-linux-musl.tar.gz
cp {input.cls} {output.cls_tmp} # copy to local directory
./tectonic {input.tex} --outdir="$(dirname {output.pdf})"
"""
And make sure that the your_benchmark:results job in your config.yml calls the snakemake compilation rule:
- snakemake --cores 1 yourbench_compile_manual
After pushing these changes, check GitLab’s pipelines. View the artifacts for this push, and make sure bench.pdf is visible in the results directory:

Conclusion
We’ve discussed ways to make benchmark figures legible and useful to others.
Analyzers should aim to make paper-ready figures that others can use and easily understand.
Analyzers should consider including an explainer artifact which describes each figure in detail. To do this:
- Copy
bench.texandbench.clsto your benchmark:physics_benchmarks/benchmarks/your_bench/ - Edit
bench.texwith descriptions of each benchmark figure - Add a rule (shown above) to your
Snakefileto compilebench.tex - Check GitLab’s pipelines for the pdf.
Key Points
Create paper-ready benchmark figures whenever possible
Clearly label plots with simulation details, and large axis labels and legends
If possible, augment the benchmark with an additional explainer document which describes figures in greater detail