All Images
Image 1 of 1: ‘Particle trajectory crossing tracking layers and showering in the barrel calorimeter’
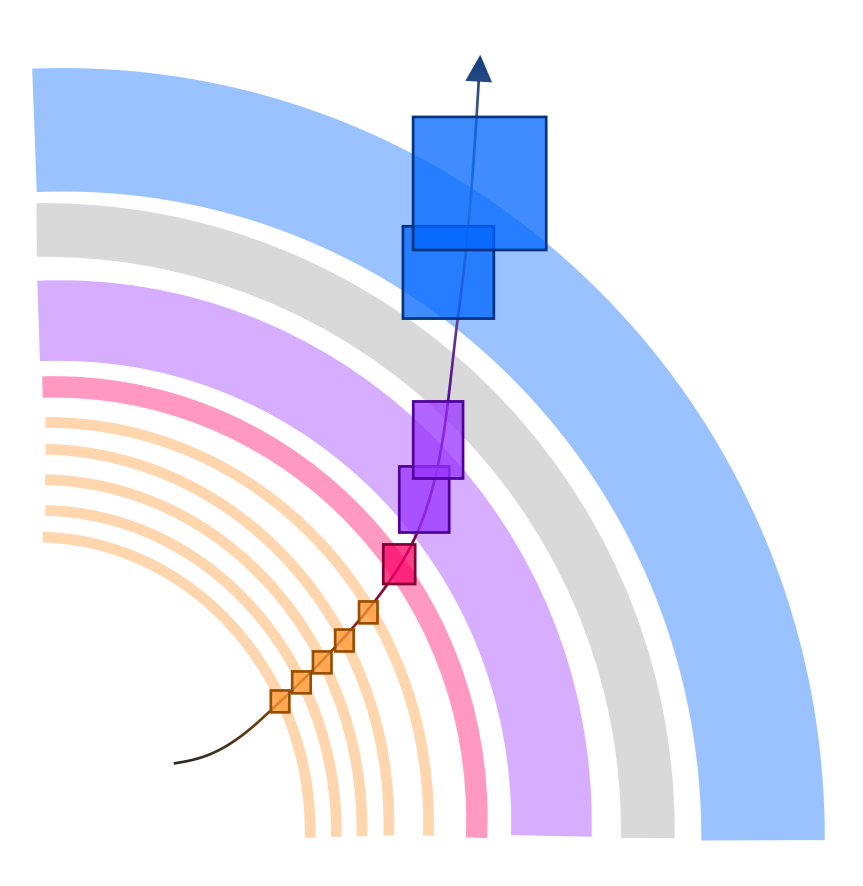
Illustration of a particle leaving signals in
several detectors
Image 1 of 1: ‘Different particle species penetrating to different depths of the detector’
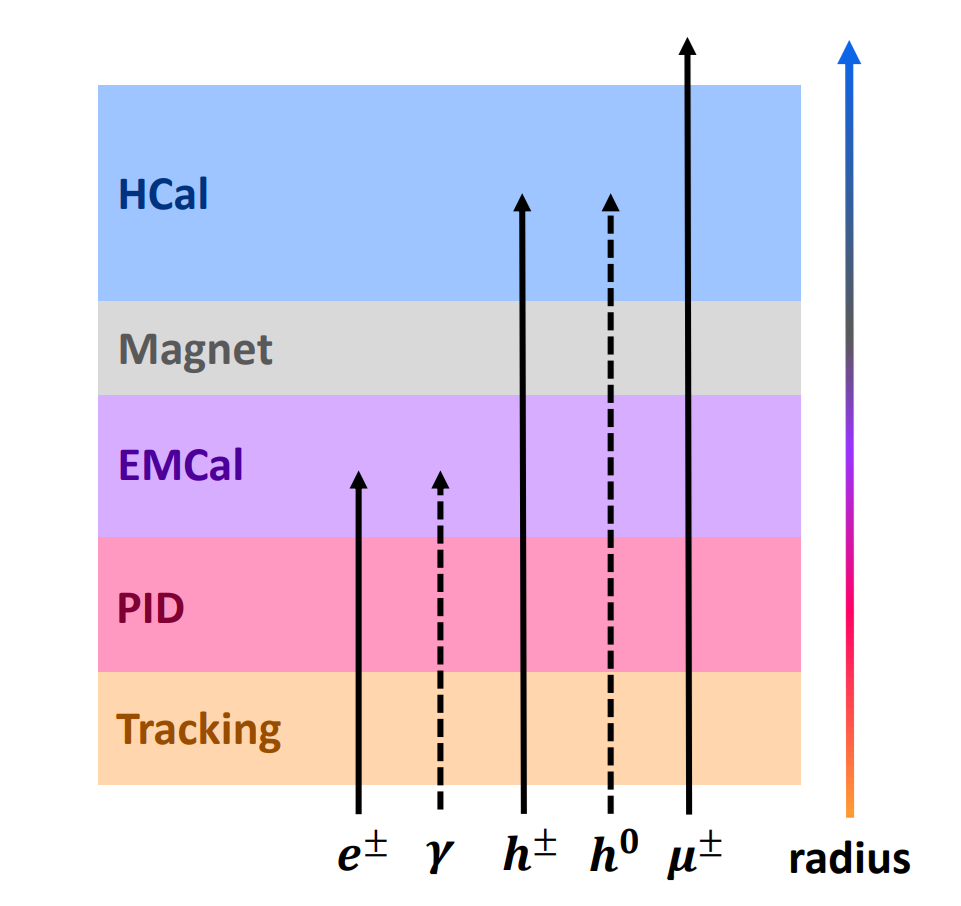
Diagram of particle types vs. typical survival
depth in a detector
Image 1 of 1: ‘Boxes for each EDM4eic data structure connected by arrows indicating their relations’
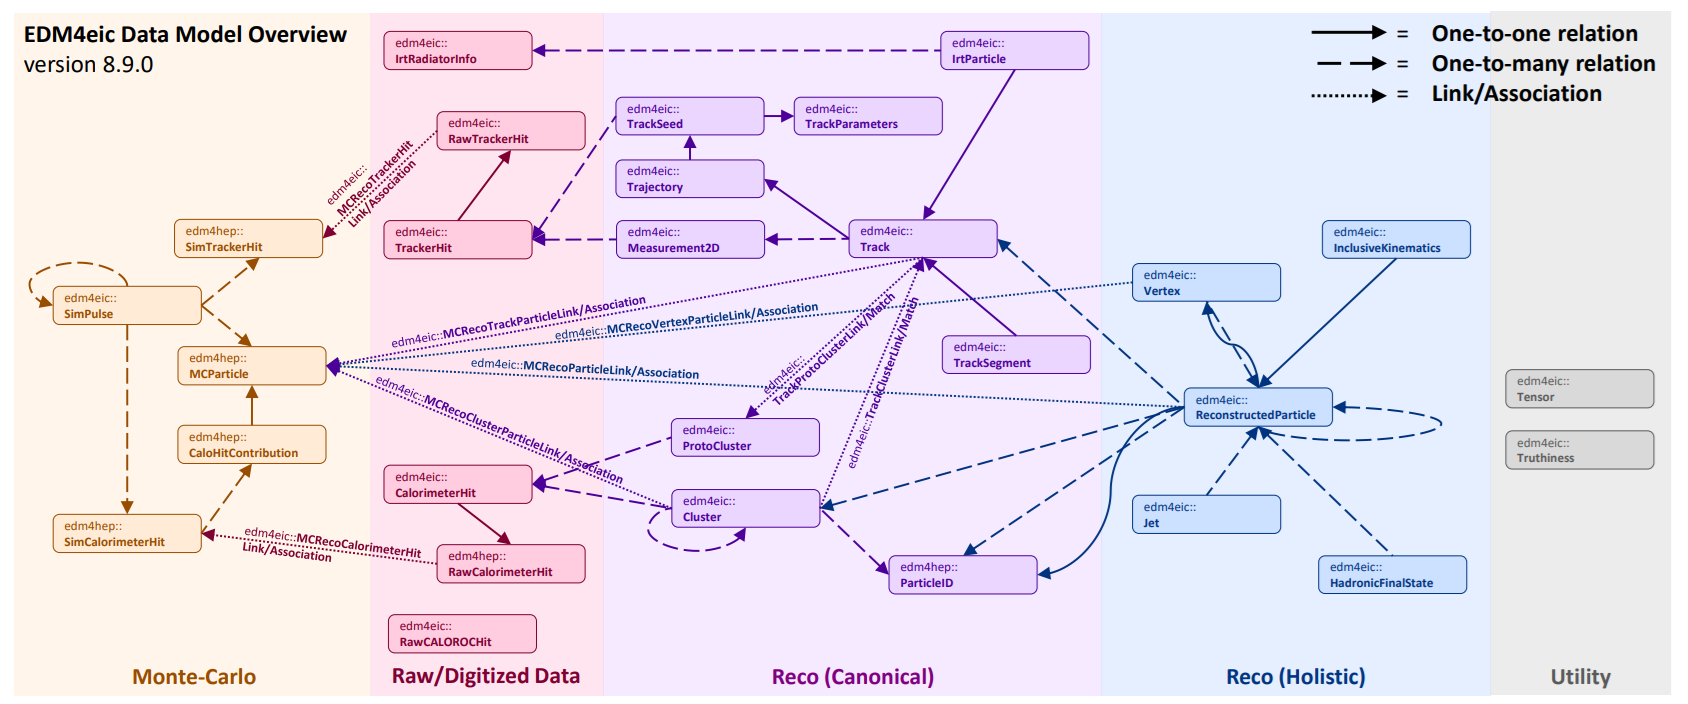
Overview of the EDM4eic data model
Image 1 of 1: ‘A track pointing to the single trajectory it was computed from’
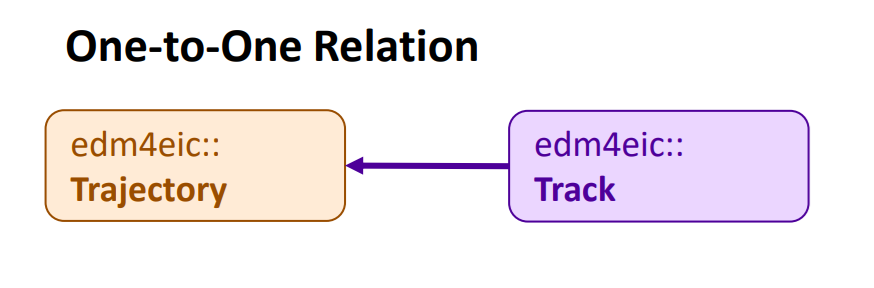
Diagram of a one-to-one relation
Image 1 of 1: ‘A calorimeter cluster pointing to the several calorimeter hits it is built from’
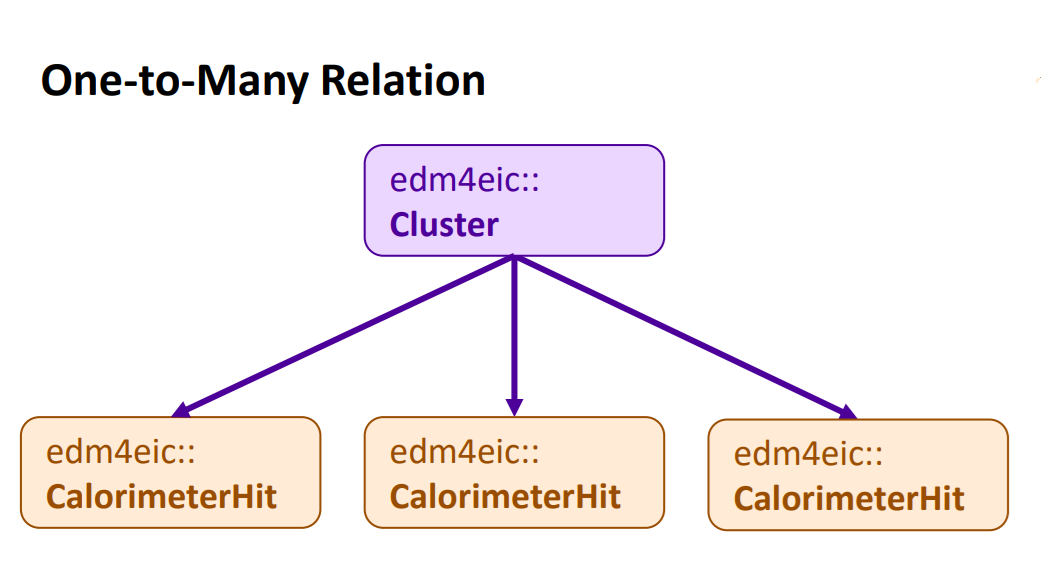
Diagram of a one-to-many relation
Image 1 of 1: ‘An association object connecting a simulated particle and a reconstructed particle’
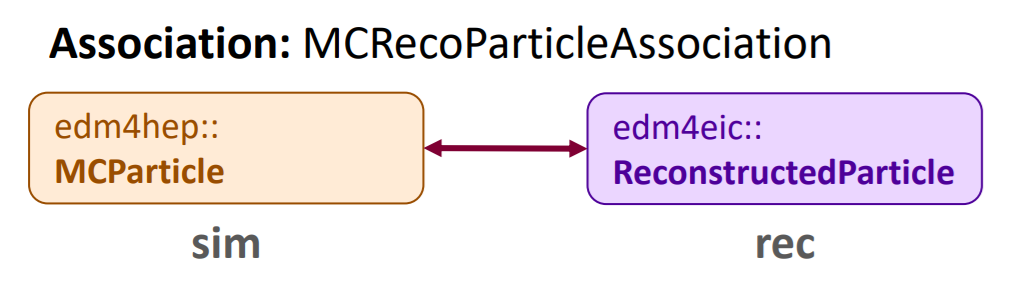
Diagram of an association
Image 1 of 1: ‘A link object pointing from a reconstructed particle to a simulated particle’
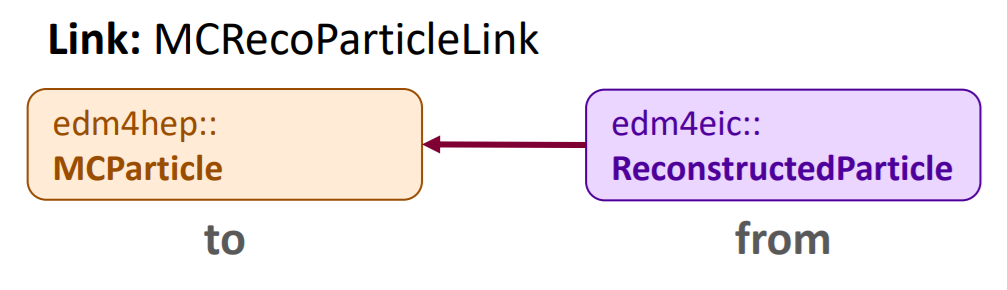
Diagram of a link
